Pick two franchises to compare their startup cost, fees and royalties — side by side, each number sourced.
Tap a common question above for an instant sourced answer — or type your own to search the 300-page document.
What does it actually cost?
Two numbers decide whether a franchise is within reach: what it takes to open the doors, and what you owe the franchisor every year you stay open. Filter all 908 brands by budget and category, and see each one's disclosed cost range against the rest of its industry.
Costs only — franchise disclosure documents publish what you pay, not what you earn. Nothing here is ranked by profit. Open in a full page ↗
Loading industry coverage…
Loading the franchise directory…
What is FranchiseLens?
A Franchise Disclosure Document (FDD) is the ~300-page legal filing every franchisor must give prospective franchisees. The numbers that actually matter — startup cost, fees, royalties, term, how many outlets have closed — are buried in tables across 23 standardized "Items." Almost nobody reads them cover to cover.
FranchiseLens reads them for you — turning those documents into a side-by-side economic comparison and instant, page-cited answers.
How it works
- Reads real FDDs. Public filings pulled from US state franchise registries, parsed into structured, page-tagged text.
- Extracts the economics. A local AI model pulls the key figures from the right sections of each document.
- Grounds every number. Nothing is shown unless it appears verbatim in the source — the model can't invent a figure. Anything unverifiable is flagged for review.
- Measured, not guessed. Extraction accuracy is checked against a hand-labeled answer set — not assumed.
- Self-hosted. Runs entirely on local models (no third-party AI APIs), with a real automated deploy pipeline.
The tabs
- Compare — franchise economics side by side, every figure linked to its source page.
- Ask — tap a common question or type your own; get a sourced answer.
- Costs — all 908 brands filtered by budget and category, each one's cost range set against its own industry.
- Directory — every loaded brand, grouped by category.
- Coverage — a survey of 65 fitness & sports franchise brands: which are in the public registry vs. loaded here.
- Feedback — tell me what's broken or missing; it reaches me directly.
Honest notes
- Where's the data from? Public FDDs filed with US state regulators. We link to the source; we don't rehost the PDFs.
- How accurate is it? Figures are AI-extracted and grounded to the source page — but always verify against the original filing before relying on them. Some secondary fields are flagged for review.
- Affiliated with the brands? No. Independent demo; all trademarks belong to their owners.
- What years? Mostly current filings (2024–2026).
How this was built
One pipeline, two front ends. The FDDs are parsed into a single structured table — 908 brands, with investment ranges, fees, royalties and ad-fund percentages — and that one table feeds both of these:
- The Costs tab — generated by a Python script directly from the extraction output into a single static page. No server, no database call, no build step; regenerating it is one command.
- A Power BI dashboard — the same table loaded over the wire as a live web source, modelled with DAX measures for median investment, fee benchmarks and per-category economics.
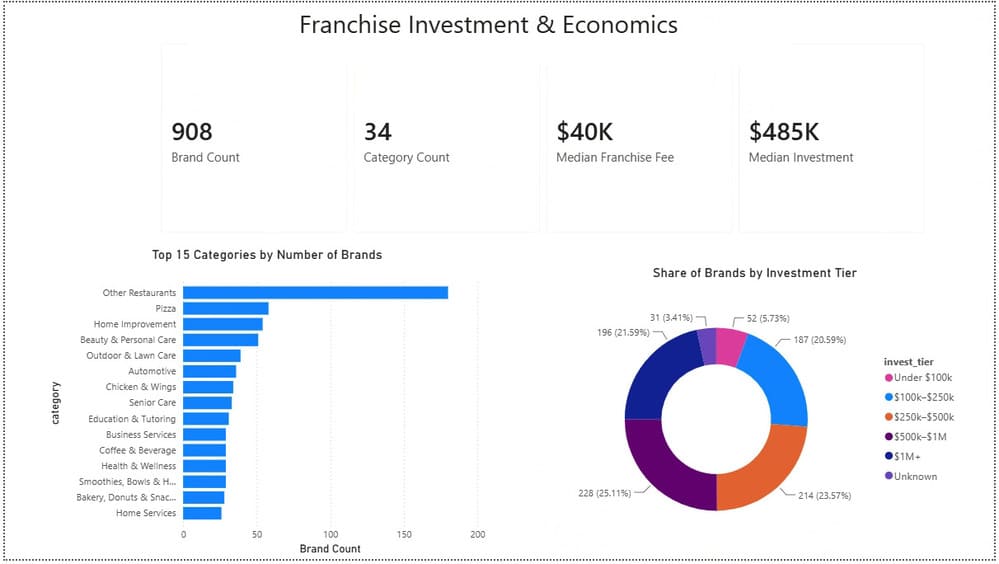 Power BI — Overview
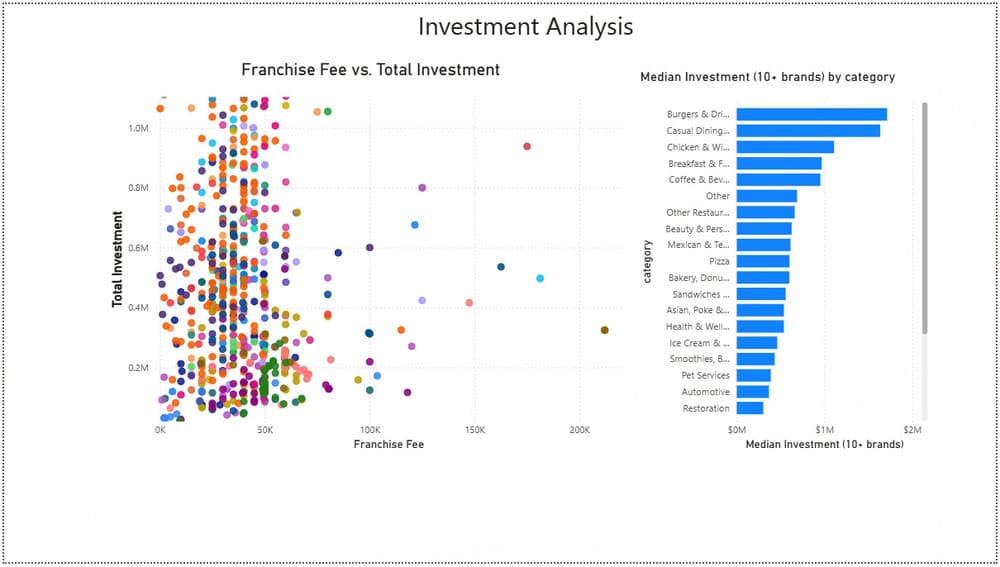 Power BI — Investment analysis
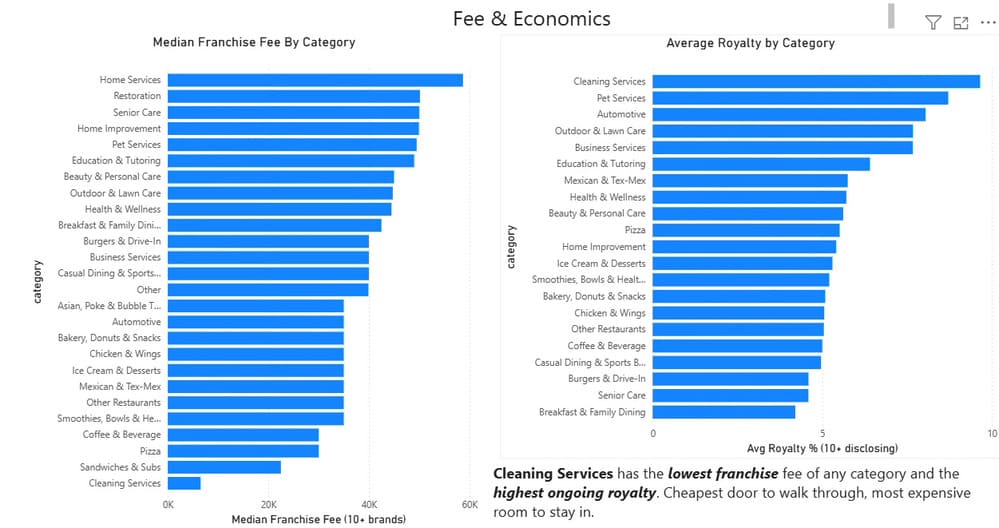 Power BI — Fees & economics
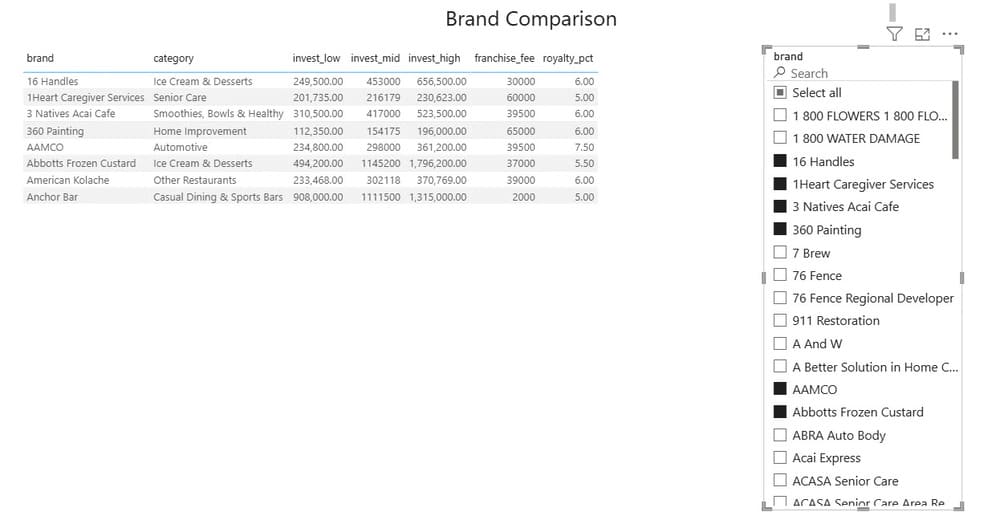 Power BI — Brand comparison
See the full Power BI case study → — all four pages at full size, the findings behind each, and the .pbix files to open in Power BI Desktop.
Both views make the same promises about the data. Ongoing cost is only counted where a brand discloses both royalty and ad fund, so a partial figure is never shown as a total. Categories with fewer than ten brands get no percentile — ranking against four peers is noise. And values that can't be real (one brand's filing parses to $135 billion) are flagged and held out of every median, rather than quietly deleted.
Who built it
Built by Alex Kargin — a background in restaurant & fitness franchising (RBI, Orangetheory), now building AI systems. FranchiseLens is a document-intelligence project: grounded LLM extraction, hybrid retrieval (pgvector), evaluation, and a self-hosted CI/CD deploy pipeline.
Feedback
Using this, hit a bug, or know a franchise we should add? I'd genuinely love to hear from you — it's the best way to know anyone's out there.